
Field-Wide Soil Analysis from Satellite Imagery
We combine multispectral satellite imagery, topographic data, and physics-informed modeling to infer soil properties. Scientifically grounded estimates, delivered fast. Read the full documentation →
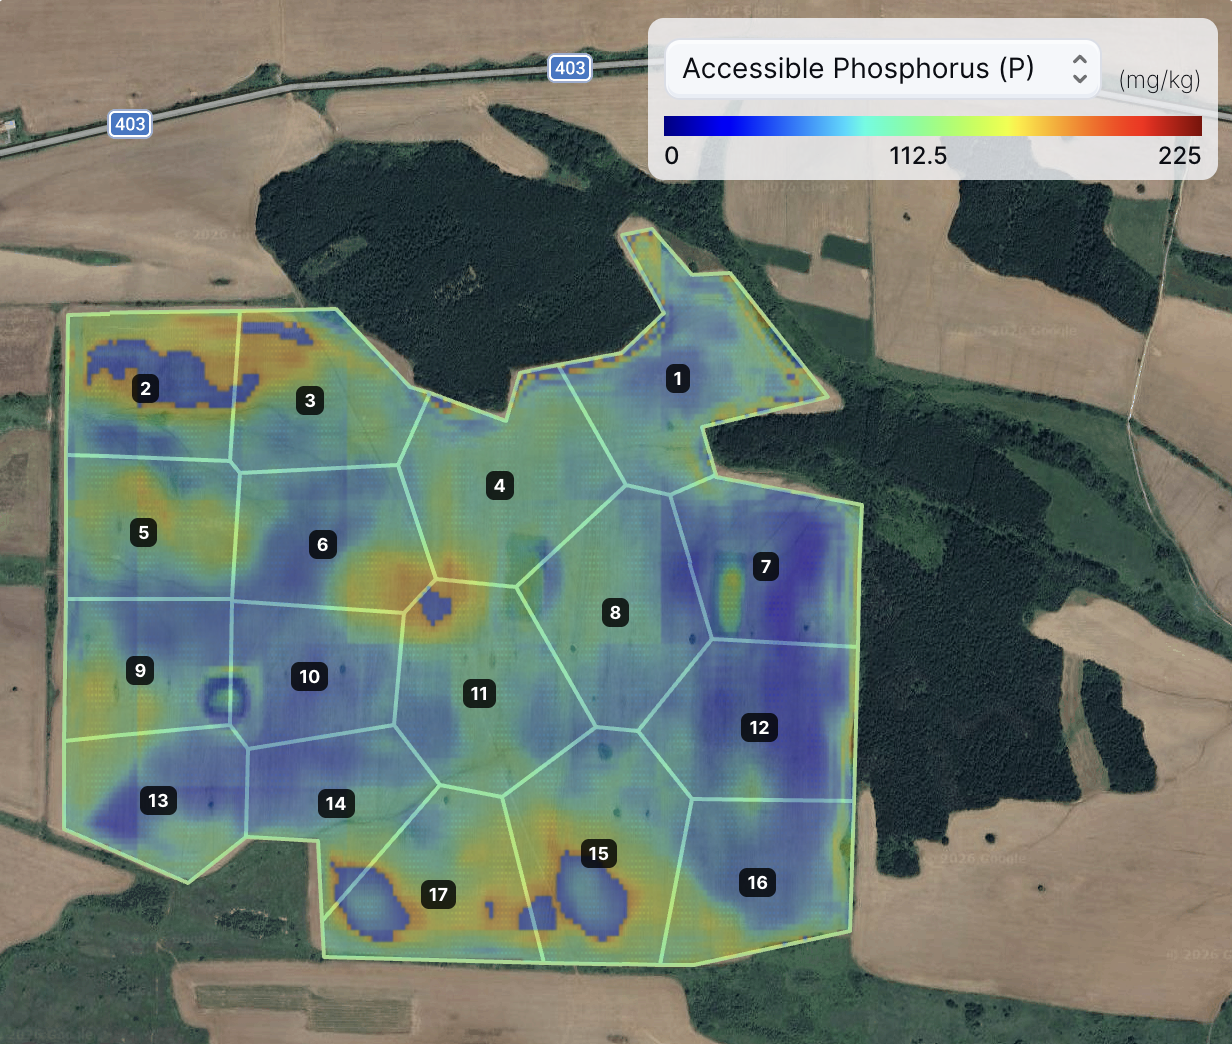
High-Resolution Nutrient Maps
Stop guessing with point samples. Siora generates a full-field heatmap at ~10 meter resolution, revealing variability you might miss with traditional sampling.
- Nutrients: Nitrogen, Phosphorus, Potassium
- Soil Health: pH, SOM, CEC
- Physical: Soil Texture (Sand/Silt/Clay)
More on each property in the soil properties documentation →
Statistical Deep Dive
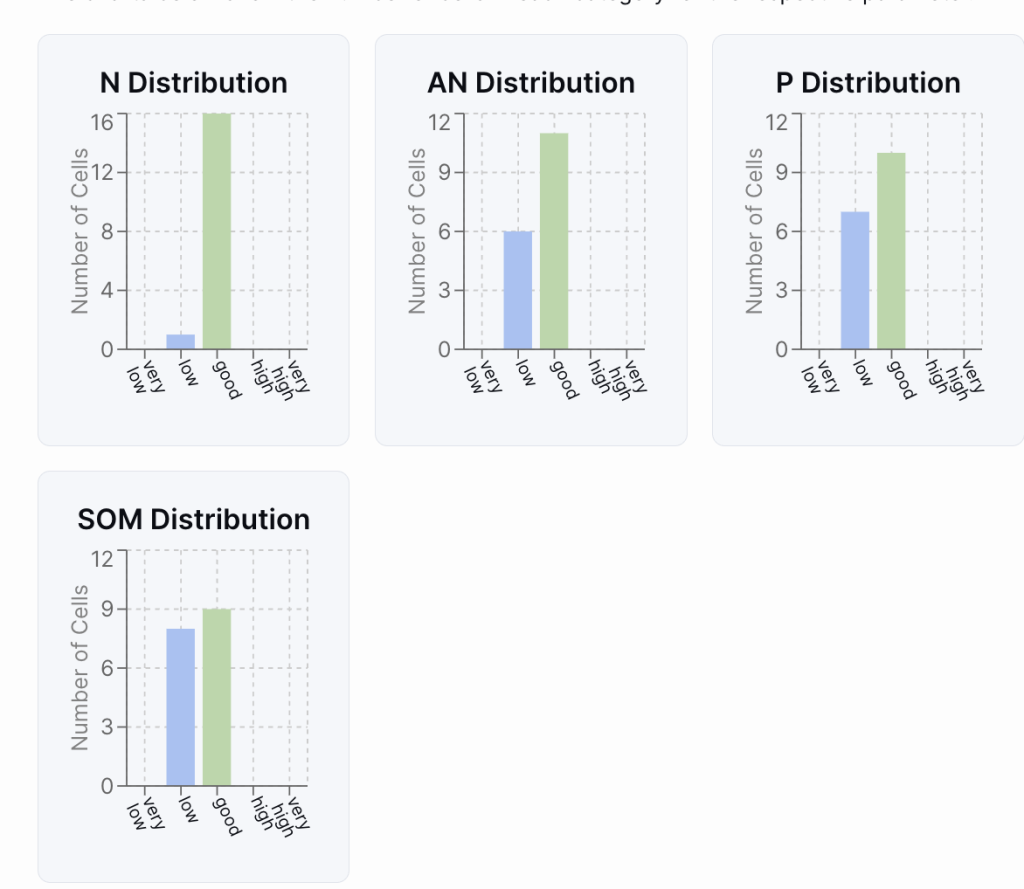
Go beyond the average. Understand the spread and distribution of nutrients across your field to identify uniformity issues or zoning opportunities.
Summary Stats: Mean per parameter.
Parameter Distributions: Nutrient distributions on a histogram.
Zoning Info: Area breakdown by nutrient level.

Built-in Historical Analysis
Siora offers up to five years of historical data, letting you track how nutrient levels and soil health evolve over time.
This enables seasonal benchmarking and supports long-term fertilization planning or sustainability reporting.
Siora used the historical analysis technology to analyse country-sized fields. Our Ukraine and Murcia, Spain datasets are freely available!
Learn how historical orders work in the ordering documentation →
How It Works
Four steps from drawing your field to using the data.

1. Draw Boundary
Select field on map or upload SHP.

2. Analyze Soil
Field-wide nutrient & physical maps.

3. Interpret Results
Automated insights & zoning info.

4. Export & Use
Download PDF, CSV, SHP for decisions.
AI Interpretations
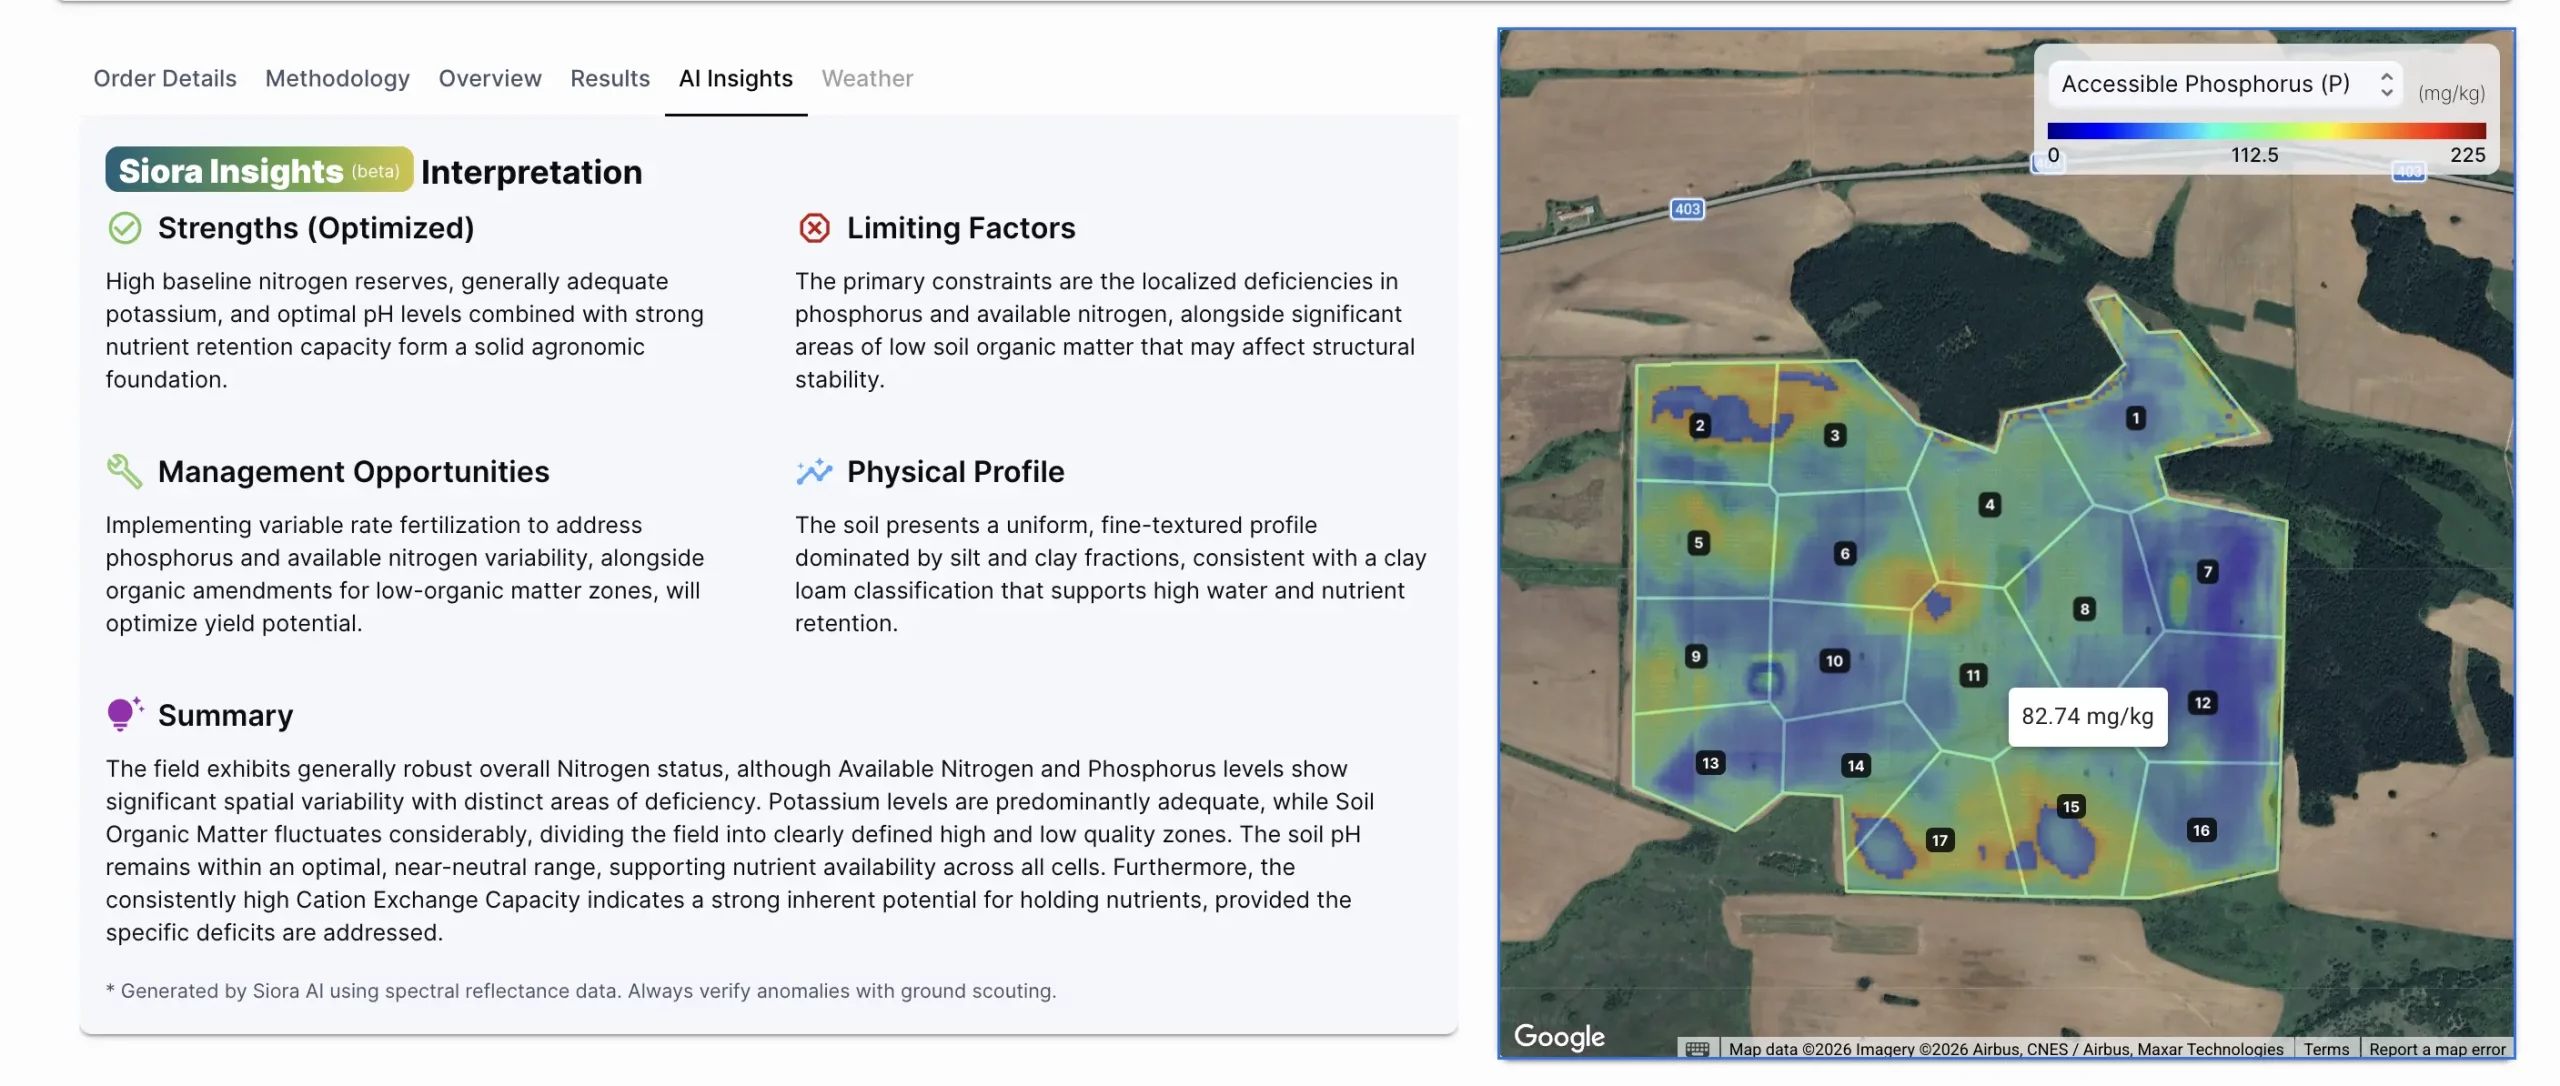
Siora Insights turns complex soil data into clear, field-ready insights.
By combining soil nutrients, texture, and CEC, it highlights strengths, pinpoints limiting factors, and surfaces management opportunities so you know where to act and why.
Each interpretation covers field summary, strengths, limiting factors, management opportunities, and physical profile. See the AI Insights documentation → for what’s in each section.
The Science Behind Siora
Multispectral Reflectance
We analyze specific light bands (visible, near-infrared, shortwave infrared) reflected from the bare soil surface to identify chemical signatures.
Moisture Correction (SAR)
Soil moisture can distort spectral readings. We use Synthetic Aperture Radar (SAR) data to correct these distortions for cleaner signal.
Vegetation Response Over Time
To strengthen nutrient interpretation, we analyze crop response patterns over multiple months prior to analysis. These time-series signals provide indirect evidence of nutrient availability and stress that may not be visible from soil reflectance alone.
Physics-Informed Modeling
All inputs are combined using models grounded in soil spectroscopy and biophysical constraints, ensuring spatially consistent and scientifically interpretable results rather than black-box predictions.
Standards Alignment
Our outputs are calibrated to align with standard extraction methods.
| Nitrogen | ISO 11261 |
| Phosphorus | Olsen P |
| Potassium | USDA-NRCS |
| SOM | ISO 10694 |
| pH | ISO 10390 |
For day-to-day product usage and report walkthroughs, see the documentation →
Scientific Validation & Practical Accuracy
Siora’s soil analysis provides field-scale insight designed for agronomic decision-making across entire fields. Results are interpreted based on intended use, spatial consistency, and agronomic relevance rather than exact point-by-point lab matching.
Interpretation Guide
Confidence levels indicate how each parameter is best used in practice. Higher confidence supports direct interpretation, while lower confidence is best used for identifying spatial patterns and relative differences.
| Parameter | Confidence | Use case |
|---|---|---|
| Soil Organic Matter | High | High confidence. Suitable for direct interpretation of soil status and spatial decision-making. |
| pH Level | High | High confidence. Suitable for direct interpretation of soil status and spatial decision-making. |
| Nitrogen | Medium-High | Medium-high confidence. Well suited for identifying spatial variability, relative differences, and management zones. |
| Potassium | Medium-High | Medium-high confidence. Well suited for identifying spatial variability, relative differences, and management zones. |
| Phosphorus | Medium | Medium confidence. Best used for identifying trends, variability, and deficiency risk rather than absolute values. |
How validation is performed
- Models are trained and evaluated on soil samples analyzed by independent laboratories using standard agronomic methods.
- Validation uses strict spatial separation, where entire regions are excluded from training and used only for testing.
- Additional test datasets include samples collected in later years to assess temporal stability.
- Performance is evaluated based on correct field-to-field ordering and identification of agronomically meaningful differences.
Practical Limitations & Scope
- Dense Vegetation: Works best on bare or lightly covered soil surfaces.
Canopy cover can limit soil signal visibility - Recent Fertilizing: Very recent management actions, such as fertilization or tillage, may not be immediately reflected in the analysis.
- Location Constraints: The system is currently optimized and validated for European soils and climatic conditions.
Laboratory Variability
Absolute nutrient values can differ between laboratories due to extraction methods, calibration, and reporting conventions. Siora’s approach is intentionally designed to reduce sensitivity to these differences by operating on relative nutrient position rather than absolute concentration.
Whitepaper
Full methodology, datasets, and detailed evaluation results are documented in our technical whitepaper.
Strategic Fit
Satellite-based soil analysis excels at delivering consistent, field-wide insight across entire fields and over time. Siora is built to provide fast, scalable context that would be impractical or prohibitively expensive to obtain through traditional sampling alone, while complementing targeted laboratory testing where precision is needed. Learn how agronomy teams and partners use this in practice.
Why Use Siora?
- Field-wide visibility at high spatial resolution, not just a handful of sample points
- Consistent methodology across seasons, regions, and years
- Rapid turnaround without field visits or sampling logistics
- Identification of spatial patterns, variability zones, and areas of potential concern
- Decision support for prioritizing sampling, variable-rate application, and field scouting
- Pairs naturally with Vegetation Monitoring for in-season crop response tracking
Designed to improve continuously
Unlike static soil tests, Siora’s models benefit from increasing data coverage, longer time series, and ongoing research. As more observations across seasons, crops, and regions are incorporated, the system becomes better at separating stable soil properties from short-term management effects and noise.
- Longer multi-year soil and crop response histories
- Improved regional calibration as reference data grows
- Integration of new satellite sensors and higher-resolution inputs
- Ongoing validation against independent datasets
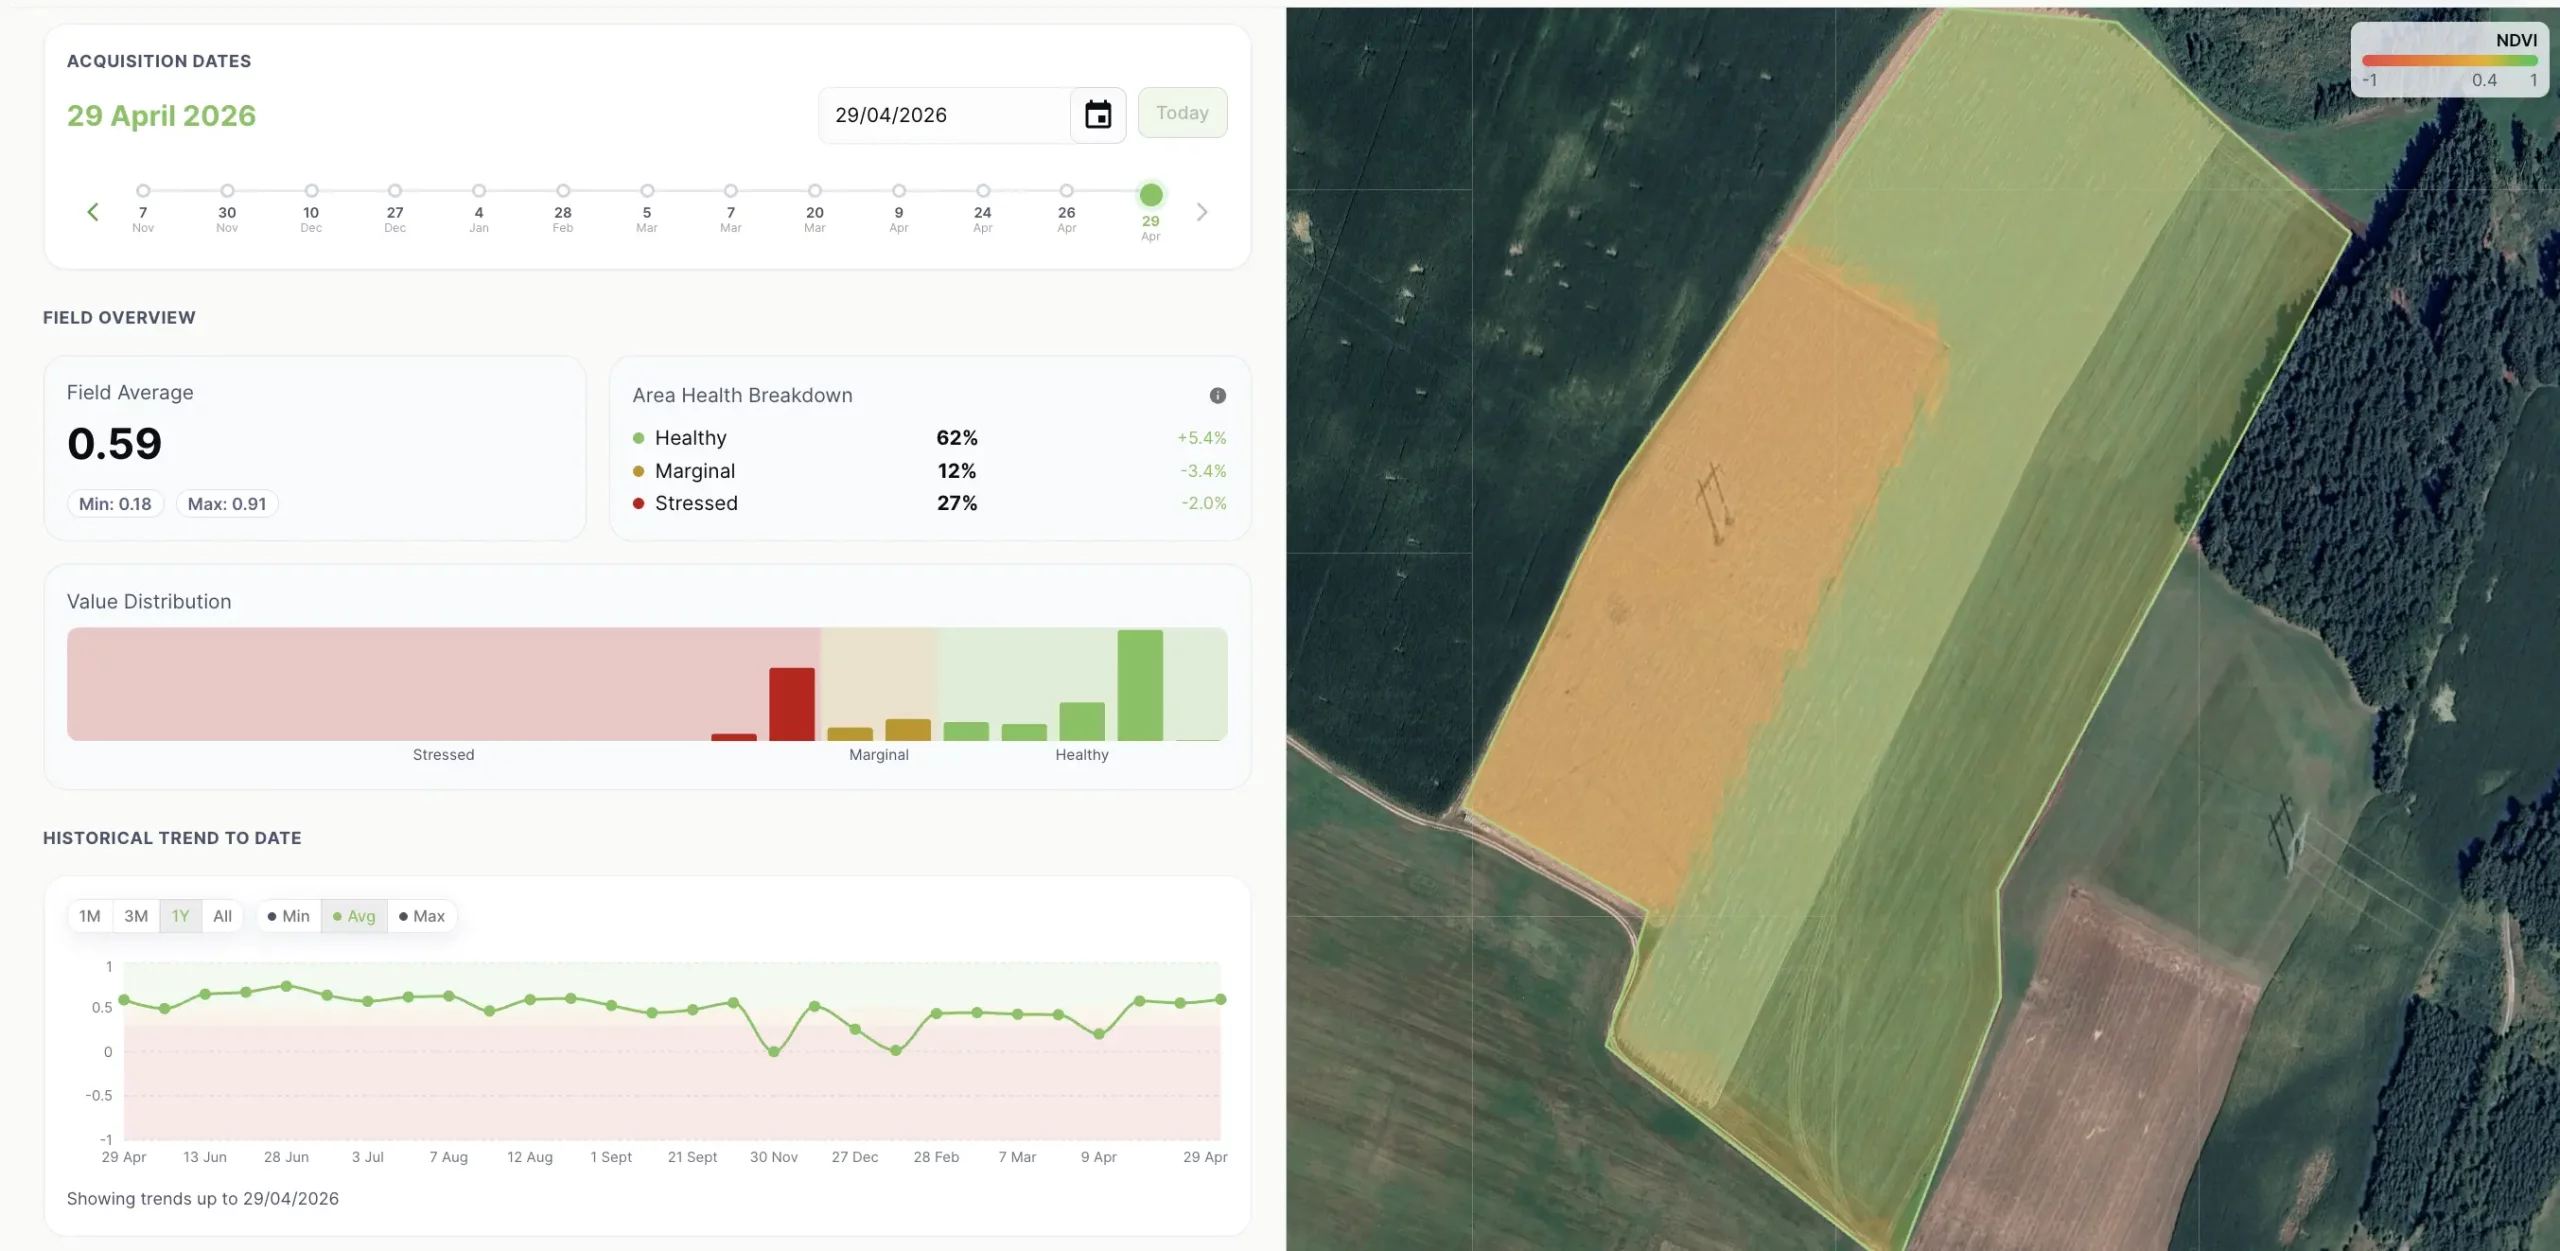
Pair with Vegetation Monitoring
Soil analysis tells you what the ground has. Vegetation Monitoring tells you how the crop responds, week by week. Combine them to track whether the management decisions you make on soil data are actually working.
- 11 vegetation indices, updated weekly throughout the season
- 3 years of historical imagery on activation
- Same export formats: PDF, CSV, Shapefile
FAQ
How deep into the soil profile does your analysis measure?
Satellite-based remote sensing primarily analyzes the topsoil layer, typically the top 0-20 cm (0-8 inches), as this is the layer that most directly interacts with the surface and influences spectral reflectance. This is also the most critical layer for nutrient management for most annual crops. More on this in the methodology documentation.
Can your analysis be used in any country and on any soil type?
Our models are robust and have been trained on a wide variety of soil types from different agro-climatic zones. However, the accuracy can be higher in regions where we have more ground-truth calibration data. If you operate in a unique or less-common agricultural area, please contact us to discuss how we can best validate the results for your specific conditions. See the methodology page for the current calibration regions.
What if my fields are covered by clouds or crops when you do the analysis?
We analyze a collection of satellite images taken over time, not just one. Our system automatically picks the best and clearest views of your bare soil to ensure the analysis is accurate and not blocked by clouds or vegetation. The ordering documentation covers how to pick the best date for your field.
Does the weather on the day of the analysis affect the results?
No, the current weather does not affect the results. We use historical satellite data of the soil itself, not a live feed, so a rainy or cloudy day won’t change the outcome.
Will the results be the same if I order an analysis for the same field next year?
The results will likely be similar, but not identical, as they will reflect any changes from your farming practices and fertilization over the year. Our analysis is sensitive enough to help you track your soil’s health and nutrient levels over time. Repeat orders are common for tracking change. See historical analysis details.
What’s in the CSV export?
Full-resolution data with raw values for each grid cell. Useful for precision ag software, analysis, and application equipment. Full schema in the exports documentation.
What’s included in the PDF report?
A summary of the field’s key soil properties, recommendations, and visual heatmaps with interpreted insights. Full report walkthrough in the report documentation.
Can I export to my farm equipment or platform?
Yes. Data can be adapted or converted to match various farm management systems. Shapefile and CSV format details in the exports documentation.
Get in touch with us
Have a question about our soil analysis service, or want to dig into how it works? Browse the documentation, contact us, or place an order.